Scientist of the Day - Charles Joseph Minard

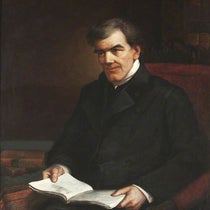
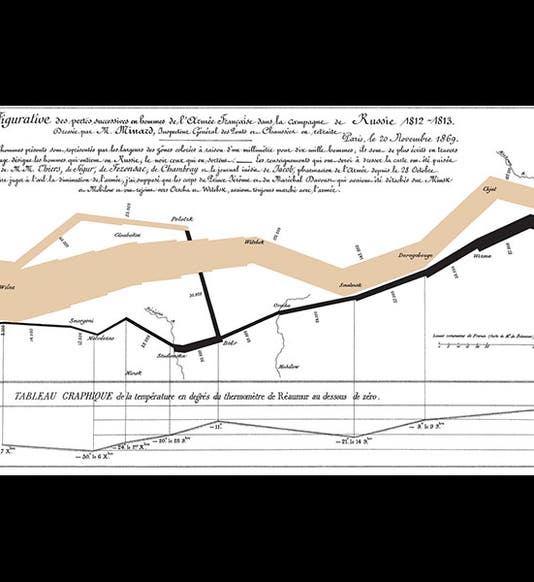
Charles Minard, a French civil engineer, was born Mar. 27, 1781. In 1869 (at the age of 88!), Minard published a thematic map that, in the opinion of many, may be the single best visual graphic ever constructed. Overlaid on a map of Europe, Minard depicted Napoleon's invasion of Russia in 1812-13 (see first image above). Napoleon's army is represented by a snaky line whose width is proportional to the size of the army. The line starts out from Europe impressively thick, a chunky beige wedge representing 422,000 soldiers. As it moves into Russia, the line thins to a quarter of its starting width, indicating that only 100,000 of Napoleon's men made it to Moscow (third image above, a detail of the right half of the map). For the return trip, the line switches appropriately to black, and it continues to shrink, until only a pencil-thin remnant of 10,000 soldiers made it back to Paris (second image above, left half of map). Accompanying the shriveling zigzag of the army is a parallel saw-toothed line below the map, indicating the frigid Russian temperature as it varied between zero and 30 below (on the Réaumur scale) for the return trip from Moscow. Edward Tufte, the leading expert today on visual graphics, featured Minard's representation in his first book, The Visual Display of Quantitative Information (1983), calling it "the best statistical graphic ever drawn." A contemporary of Minard observed that the map "defies the pen of the historian in its brutal eloquence." We have long sought a reason to acquire this graphic for the Library; it technically belongs to military history and is thus out of scope, but it is also the most influential thematic map of the century, and we have a very good selection of 19th century thematic maps in our collections. We also have three books by Minard, but they come from his civil engineering career in the 1830s and 1840s, before he set out to re-invent the graph. For those who are curious, -20º Ré is equivalent to -25º C or -13º F – far too cold by any scale to be marching back from Russia in summer woolens. Dr. William B. Ashworth, Jr., Consultant for the History of Science, Linda Hall Library and Associate Professor, Department of History, University of Missouri-Kansas City