Scientist of the Day - John Bartholomew
John George Bartholomew, a Scottish cartographer and publisher, was born Mar. 22, 1860. In 1911, Bartholomew and two colleagues issued a large volume of maps that he called Atlas of Zoogeography. Zoogeography had, ever since Alexander von Humboldt, become an important part of zoology. Its subject was the distribution of animals around the world. It became even more relevant after Charles Darwin and Alfred Russell Wallace, since both naturalists believed that evolution by natural selection provided the best explanation for the unusual distribution of animals around the globe. You can publish a work on zoogeography without maps. But mapping animal distribution can allow one to see animal populations in a whole new way.

Title page, John George Bartholomew, Atlas of Zoogeography, 1911 (Linda Hall Library)
Bartholomew was not the first to produce zoogeographic maps. Heinrich Berghaus in Germany published a very large (and very heavy) thematic atlas in the 1840s that included quite a number of maps of, say, the distribution of horses and cows. We have that atlas in our collections, and one day we will write a post about it. The Scottish cartographer Alexander Keith Johnston was inspired by Berghaus to publish his own thematic atlas in the 1850s, which included several zoogeographic maps; we have several editions of his atlas, and we have done a post on Johnston. As you can see if you consult that post, Johnston was more interested in portraying the animals of the world in vignettes than he was in the maps themselves.

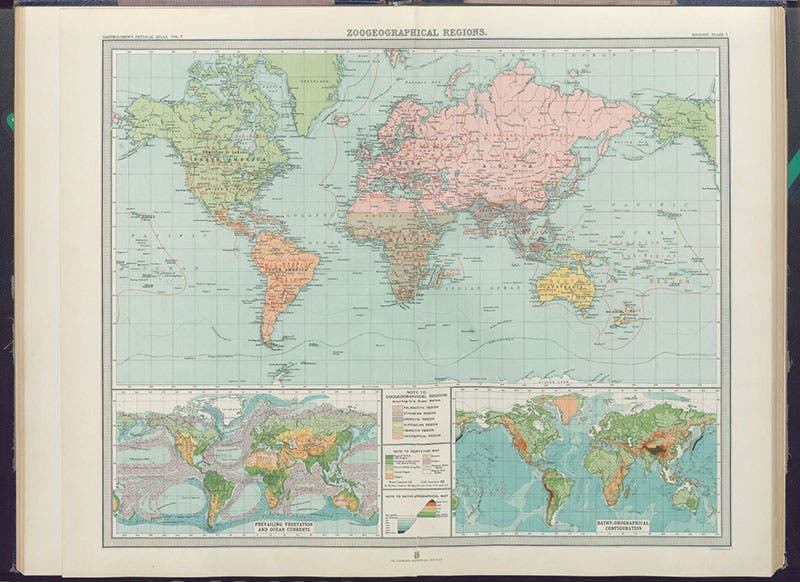
Zoogeographical map of the world, in John George Bartholomew, Atlas of Zoogeography, 1911 (Linda Hall Library)
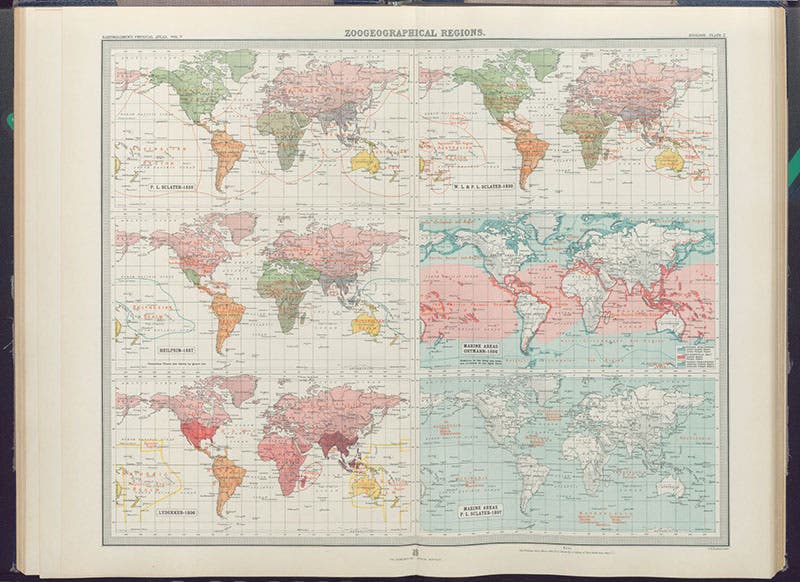
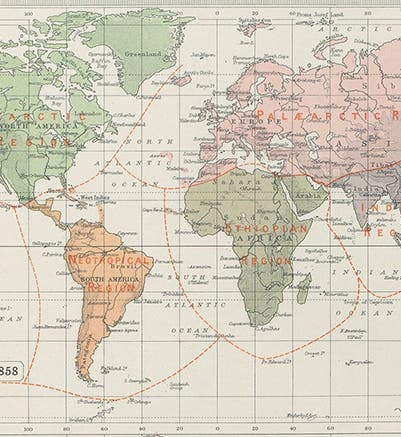
Historical zoogeographical map, showing six attempts between 1858 and 1899 to divide the world into major zoological regions, in John George Bartholomew, Atlas of Zoogeography, 1911 (Linda Hall Library)
Zoogeography rose to a new level when Philip Lutley Sclater, in 1858, pointed out that one could divide the world's animals into six different regions. which he called: Nearctic, Neotropical, Palaearctic, Ethiopian, Indian, Australian. The line between the Indian and Australian regions ran right through the middle of the Malay archipelago, a demarcation that Wallace discovered and which is still called Wallace's line. Sclater did not make a map. Later zoogeographers revised Sclater’s regional names and borders, and some of them did construct maps, such as Angelo Heilprin (1887) and Richard Lydekker (1896). We reproduce Lydekker’s map just below.

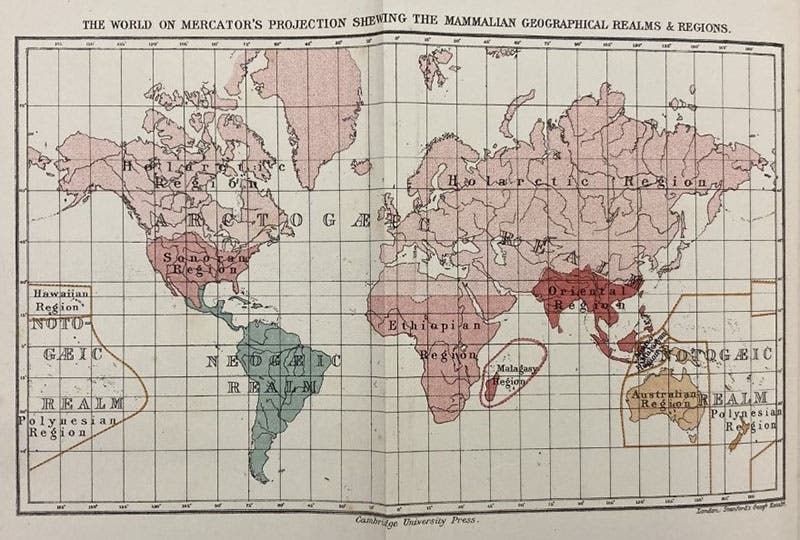
Map of the geographical distributions of mammals, Richard Lydekker, A Geographical History of Mammals, 1896 (Linda Hall Library)

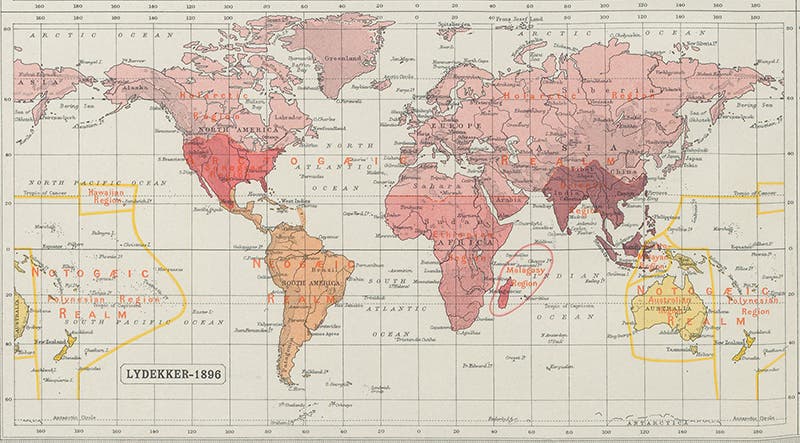
Lydekker’s map (fifth image) redrawn, in John George Bartholomew, Atlas of Zoogeography, 1911 (Linda Hall Library)
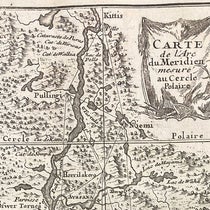
What makes Bartholomew's atlas so special is that, not only did he provide his own up-to-date zoogeographical map in his atlas (third image), but he also constructed a history-of-zoogeography map, on which he displayed six earlier attempts to provide zoological maps (fourth image). We began with Bartholomew’s map of Sclater's regions (first image), and since Sclater did not make a map, Bartholomew had to construct this one from scratch based on Sclater's text. Where there were maps, as with Lydekker and Heilprin, Bartholomew redid them, so that all six maps are in a uniform style, and it is easy to see how they differ in dividing up the world of animals. His version of Lydekker’s map is just above (sixth image).

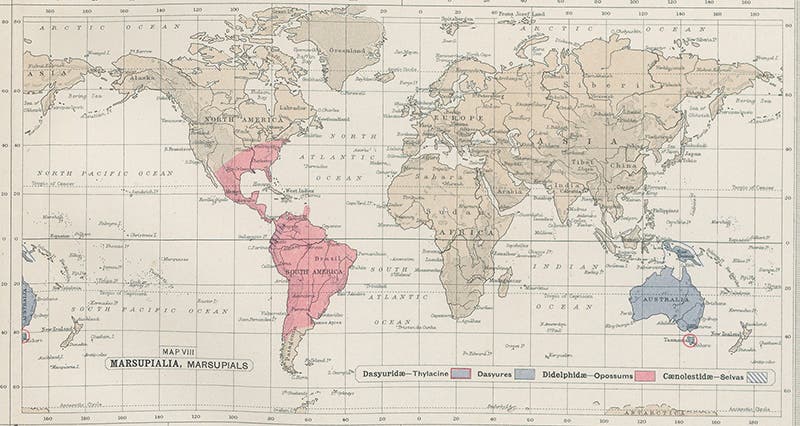
The rest of the maps in Bartholomew's atlas focus on individual orders of animals. We include here a detail of a plate devoted to edentates, marsupials, and monotremes, containing 10 maps of each of the major families - we show you a detail of the one for marsupials, where you can see the Australian group in one color, and the South-American opossums in another (seventh image, just above).
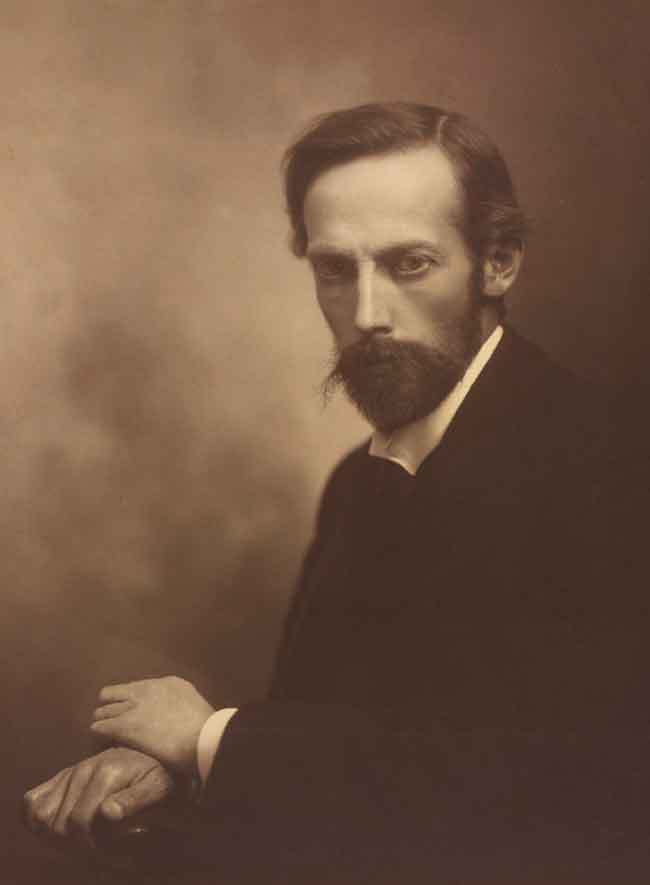
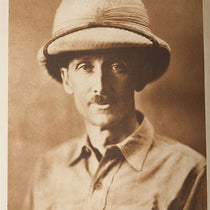
Portrait of John George Bartholomew, photograph, undated (National Libraries of Scotland)
Bartholomew was highly respected in his native Edinburgh and there are quite a few oil portraits of him in academic garb. We rather prefer the simplicity of this photograph, in the National Libraries of Scotland.
Dr. William B. Ashworth, Jr., Consultant for the History of Science, Linda Hall Library and Associate Professor emeritus, Department of History, University of Missouri-Kansas City. Comments or corrections are welcome; please direct to ashworthw@umkc.edu.