Scientist of the Day - Edward Bullard
Edward Bullard, a British geophysicist usually referred to as "Teddy," was born Sep. 21, 1907. Bullard studied physics at Cambridge University with Ernest Rutherford, but decided to go into geophysics rather than nuclear physics. After the war, he spent some time in the public sphere, becoming head of the National Testing Laboratory and receiving a knighthood in 1953 when Elizabeth ascended the throne. Eventually, he returned to academia, serving as assistant and then as reader in the Department of Geodesy and Geophysics at Cambridge, before a professorship was finally created for him at Churchill College. Presumably he did something to merit his knighthood, but I have no idea what it was, as most of his notable scientific accomplishments came in the 1960s.

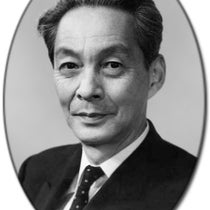
Portrait of Edward Bullard, photogreaph, 1955, National Portrait Gallery, London (npg.org.uk)
At that time, continental drift was the topic of the hour in geophysics, and Bullard seems to have been favorably inclined in its favor. He had been impressed when the Australian Warren Carey in 1955 and 1958 produced a map that fitted South America and Africa together, just as Alfred Wegener had tried to do in a more general way in 1915, and it was a pretty good fit. But Carey’s map was a visual fit, and thus open to criticism, and Bullard wondered whether, at the dawn of the computer age, it might be possible to have computers make the fit and remove the human element. He turned the project over to a student, Jim Everett, who had both mathematical and computer skills. Bullard and Everett decided to use continental margins rather than shorelines as borders, since shorelines can change dramatically with a change in sea level. They chose the 500-fathom depth for their continental "edges". Everett first produced a computer map fitting South America and Africa together (first image). He (and the computer) used something called Euler's point theorem to reposition the continents. In that theorem, Leonhard Euler recognized that the only way a line can move on a sphere is as if it were rotating about a point. The computer had to plot the rotation points and then do the moving.

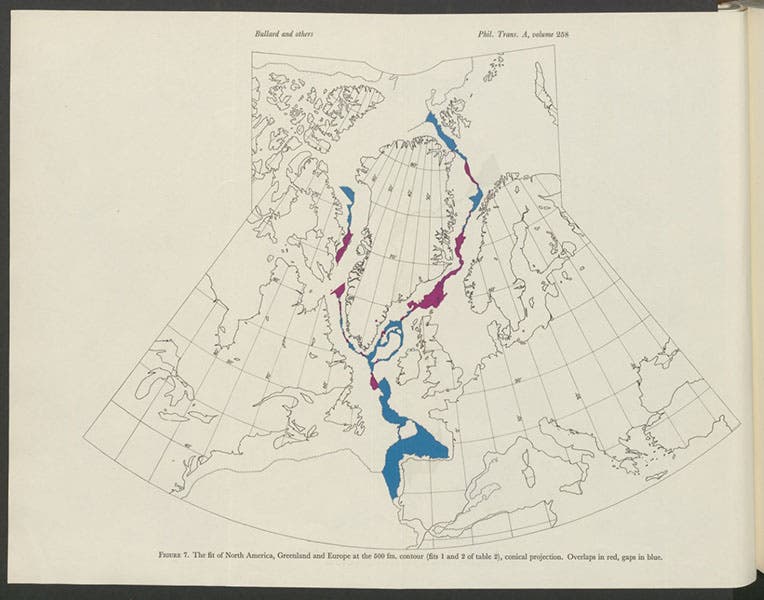
North America, Greenland, and Europe joined at 500-fathom depth, computer-generated map programmed by Alan Smith and Jim Everett, in Philosophical Transactions of the Royal Society of London, vol. 258A, 1965 (Linda Hall Library)

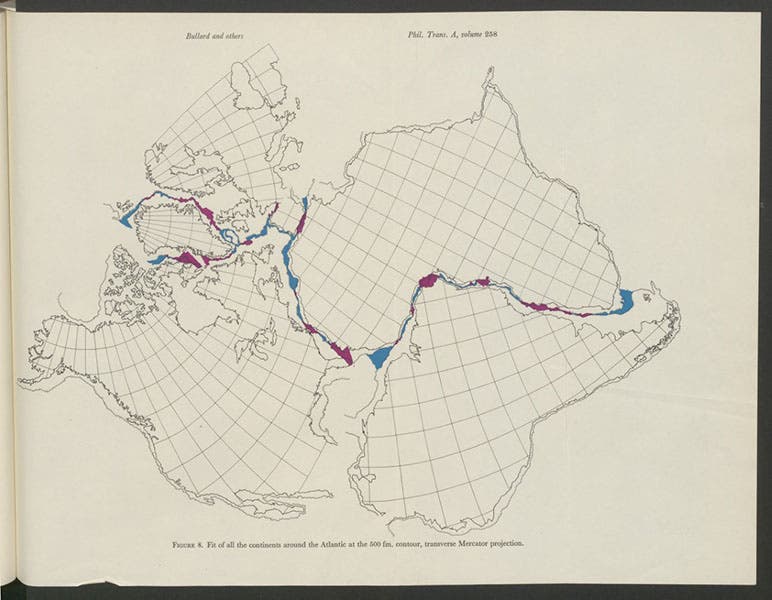
All the Atlantic Ocean land-masses joined at 500-fathom depth, computer-generated map programmed by Alan Smith and Jim Everett, in Philosophical Transactions of the Royal Society of London, vol. 258A, 1965 (Linda Hall Library)
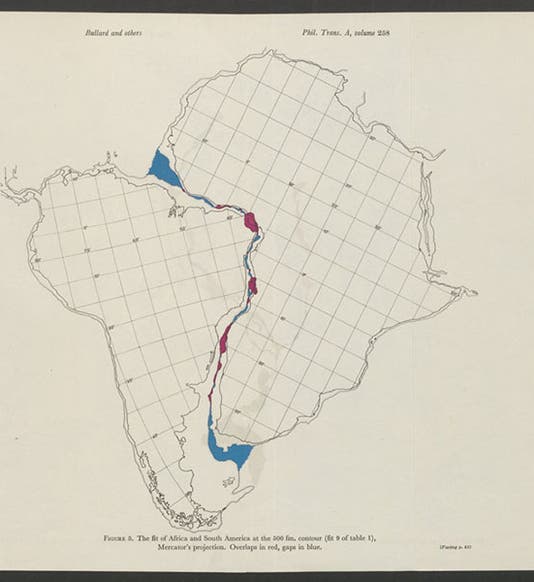
The South America/Africa join was remarkably good, with just a few areas, like the Niger River delta, where there was more overlap than there should be. Another student, Alan Smith, then joined the project, and he helped produce further maps of North America/Greenland/Europe, and then the entire Atlantic seaboard (third and fourth images, above). In all of them, the fit was surprisingly good, almost as if the Americas, Europe and Africa had indeed once been joined up as a supercontinent. The maps drawn by the computer were black-and-white outlines, but the areas where there were overlaps between continents were afterwards colored in red, and the gaps were colored blue. That small touch of color was dramatic (see detail of third map, fifth image).

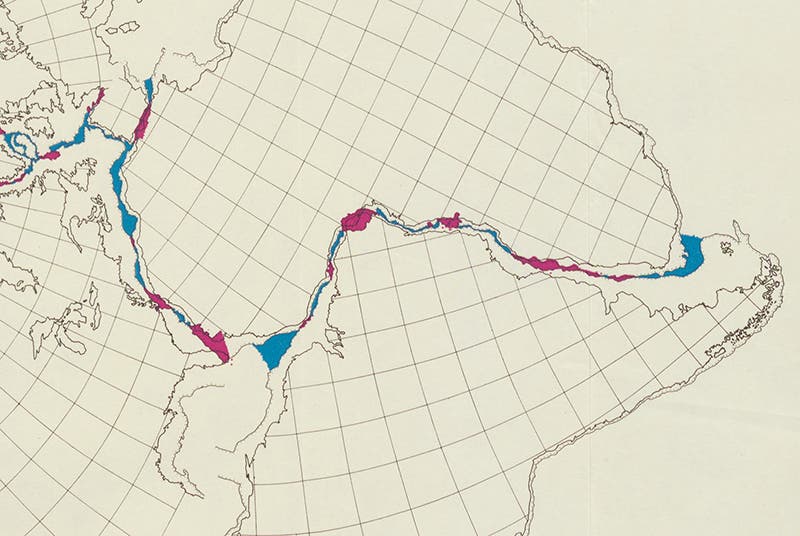
The South America/Africa join, detail of fourth image (Linda Hall Library)
A Symposium on Continental Drift, sponsored by the Royal Society of London, was held at the Royal Institution on Mar. 19 and 20, 1964 (seventh image), and a paper by Bullard, Everett, and Smith was the fourth on the program. It was the hit of the show – such is the power of novel graphics. Bullard wrote the paper (sixth image), and listed himself as first author, but all of the work in preparing the maps was done by Everett and Smith. Still, it was Bullard's idea to pursue the research, and he did write a compelling paper. Perhaps his finest achievement was in convincing the Royal Society that the published maps should be printed in color, so that the dramatic touches of red and blue could have the desired effect. Color printing was quite costly in those days, but the Royal Society agreed, and they were wise to do so. The three maps we have been looking at are those published in the Philosophical Transactions of the Society in 1965.

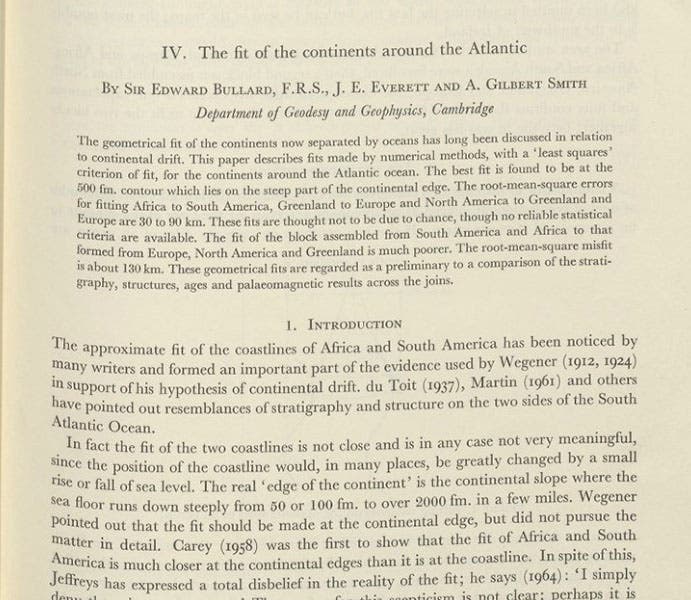
Detail of first page of paper by Edward Bullard, Jim Everett, and Alan Smith, Philosophical Transactions of the Royal Society of London, vol. 258A, 1965 (Linda Hall Library)
Some years ago, I was talking about Bullard with Henry (Hank) Frankel, a dearly missed colleague of mine at UMKC and author of the prodigious four-volume work, The Continental Drift Controversy (2012). It was Hank who told me the story about Bullard and the pressure he applied to get the maps printed in color. Hank was then preparing the illustrations for his book, and he said that he too insisted to his publisher (Cambridge University Press) that the Bullard maps be reproduced in color. He says they just laughed at his request. I guess it helps if you have a knighthood.

Title page of Symposium on Continental Drift, held Mar. 19-20, 1964, at the Royal Institution, and published in Philosophical Transactions of the Royal Society of London, vol. 258A, 1965 (Linda Hall Library)
Everett and Smith later (much later, in 2002) wrote an article on the evolution of the map-fitting project, and they seemed genuinely unconcerned that Bullard often was given credit for the maps that they constructed. As I write this, the paper is available online as a PDF. Interestingly, I could find no photograph of the three authors together. Nor could I find a photograph of Bullard in or around 1963 – most online photos show him 15 years older. So I settled for a photograph of Bullard in 1955, when he was a Sir but not yet even an assistant in the Department of Geodesy and Geophysics at Cambridge (second image).
Dr. William B. Ashworth, Jr., Consultant for the History of Science, Linda Hall Library and Associate Professor emeritus, Department of History, University of Missouri-Kansas City. Comments or corrections are welcome; please direct to ashworthw@umkc.edu.