Scientist of the Day - F. Gowland Hopkins
Frederick Gowland Hopkins, an English biochemist, was born June 20, 1861. Hopkins was the first professor of biochemistry at Cambridge and helped found their Department of Biochemistry. In 1912, Hopkins published a paper with the bland title, “Feeding Experiments Illustrating the Importance of Accessory Food Factors in Normal Dietaries,” in the Journal of Physiology. In the paper, he reported the results of experiments demonstrating that lab rats fed on diets of pure protein and other known nutrients lost weight; they apparently needed minute quantities of additional "food factors" to survive. These factors later came to be called vitamins, and Hopkins shared the Nobel Prize in Physiology/Medicine in 1929 for the discovery of vitamins.

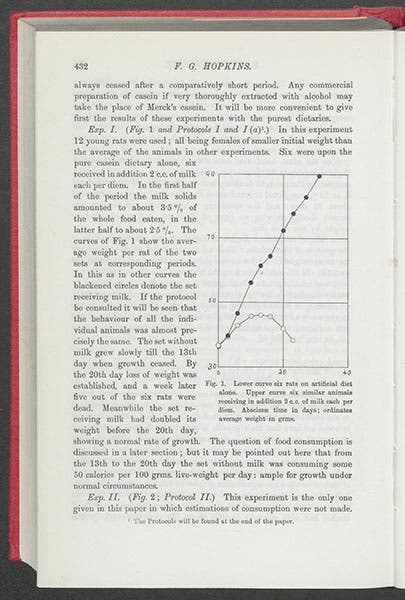
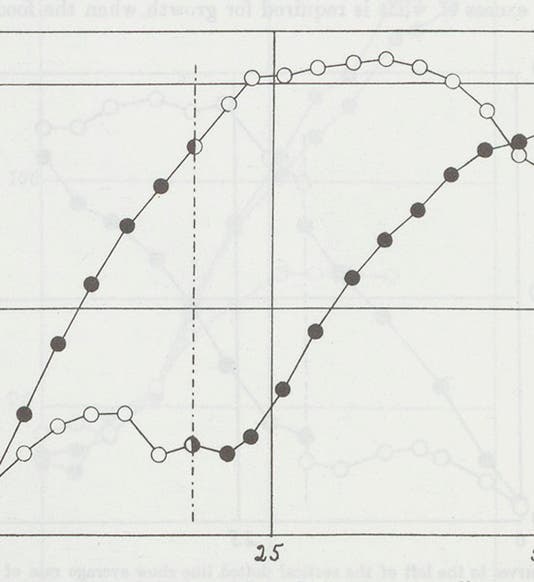
Graph comparing rats fed on an artificial diet (white dots) and rats fed a milk supplement (black dots), from F. Gowland Hopkins, “Accessory Food Factors,” Journal of Physiology, 1912 (1964) (Linda Hall Library)
Historians have often wondered why Hopkins got the Nobel award, since in fact he never isolated a single vitamin, and many other researchers made contributions at least as important as his. One analysis gives two reasons: first, Hopkins chaired a committee that wrote an influential report on vitamins in the 1920s, and he not surprisingly gave himself a great deal of the credit. But the second explanation we find quite interesting, and plausible: Hopkins’s 1912 paper had far better diagrams than those of his rivals.

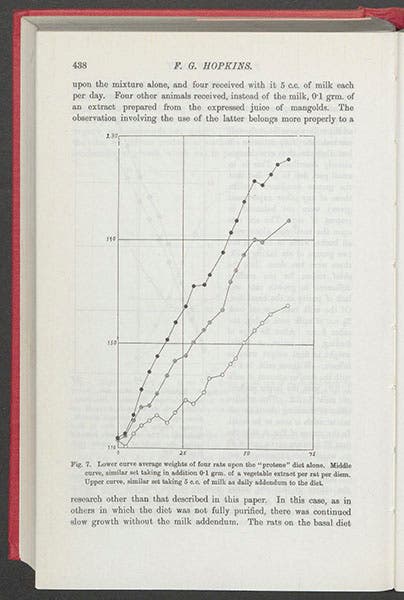
Graph comparing rats fed on a “protene” diet (lower curve), those with a vegetable extract supplement (middle curve) and rats fed a milk supplement (upper curve), from F. Gowland Hopkins, “Accessory Food Factors,” Journal of Physiology, 1912 (1964) (Linda Hall Library)
Other investigators used graphs, but they made their graphs scientifically respectable by including statistical margins of error, which rendered the diagrams messy and uninviting. Hopkins's graphs may be statistically short-changed, but they are incredibly clear and powerful. We see three of them here.
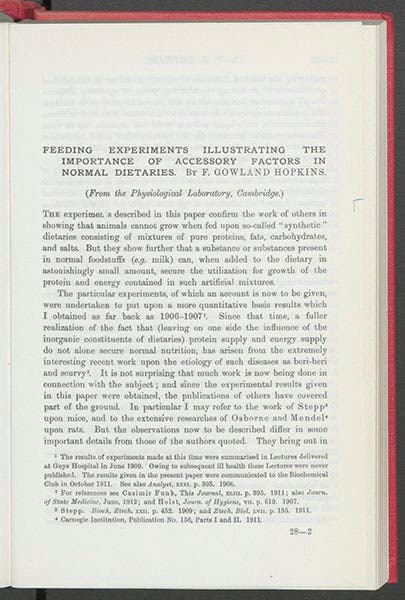
First page of F. Gowland Hopkins paper on “Accessory Food Factors” in Journal of Physiology, 1912 (1964) (Linda Hall Library)
A line connects the black dots, indicating rats getting a milk supplement (and hence vitamins) and rises steadily, as the rats gain weight; the white dots, denoting rats on pure protein, generate a line that goes up briefly, and then down. And as the white dots turn black, indicating that those rats are now getting vitamins, the lines immediately surge upward again. Powerful stuff. These are the diagrams that everyone still reproduces, and they are inextricably linked with Hopkins's name. So Hopkins really got a Nobel Prize for best graphics. In a world in which we are continually beset on all sides by inept, information-less graphics, perhaps that is not a bad thing.

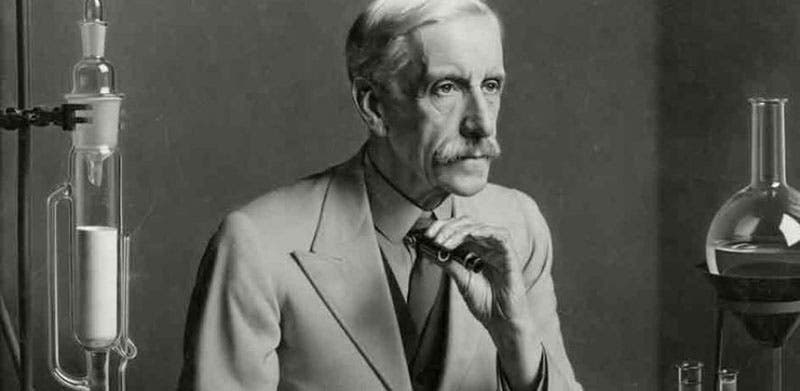
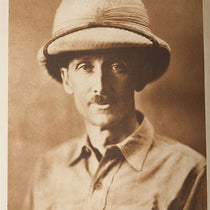
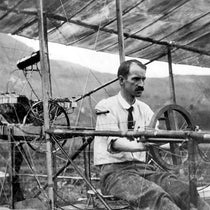
Portrait of Frederick Gowland Hopkins, 1938, photograph of detail (University of Cambridge)
We should note that our run of the Journal of Physiology is interrupted by a dozen facsimile volumes, reprinted by Dawsons in 1964; Hopkins’ paper is in one of those reprinted volumes. We try to show original papers and books whenever possible in these posts; when we cannot do so, it is disappointing, but sometimes unavoidable.

Hopkins’ house at 71 Grange Road, Cambridge, where a blue plaque was installed in 2011 (see detail below) (Wikimedia Commons)
There is a blue plaque on Hopkins’ former home in Cambridge, installed in 2011 (sixth and seventh images). Our portrait (fifth image) is a photograph of the top half of a pastel portrait of 1938 at the Royal Society of London.

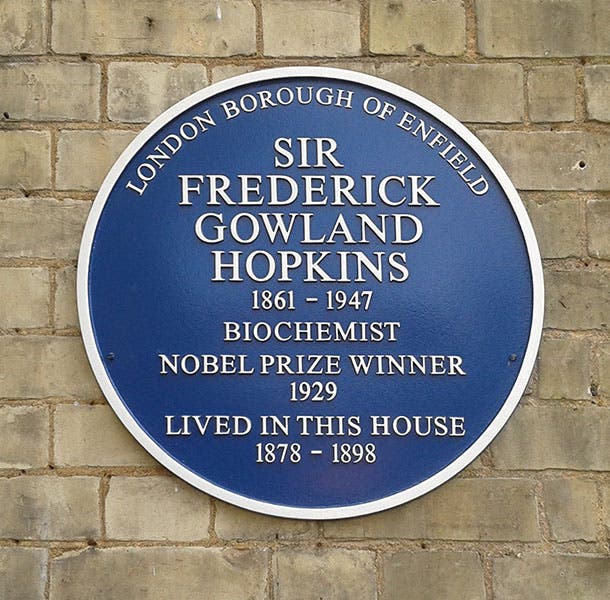
Blue plaque installed on Hopkins’ home in 2011 (blueplaqueplaces.co.uk)
Dr. William B. Ashworth, Jr., Consultant for the History of Science, Linda Hall Library and Associate Professor, Department of History, University of Missouri-Kansas City. Comments or corrections are welcome; please direct to ashworthw@umkc.edu.